4Q2016 : Apple dethrones Samsung to become biggest smartphone maker in world
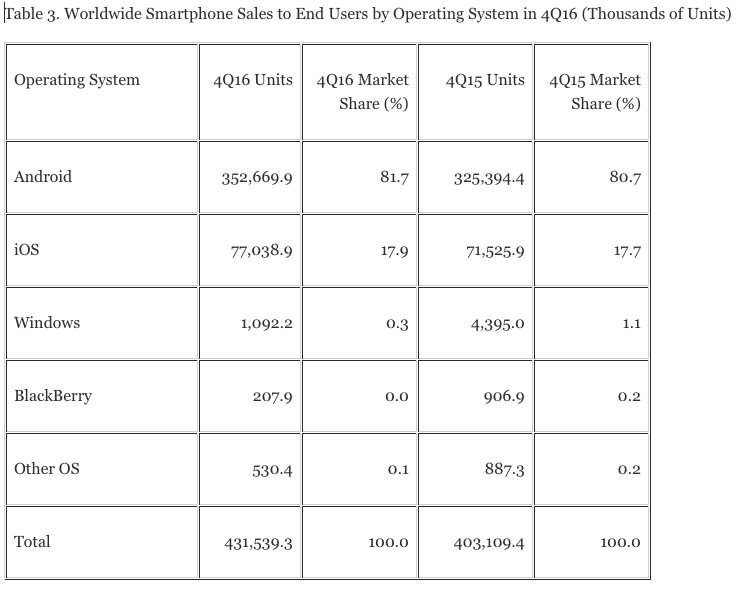
Thanks to iPhone 7 pair selling in huge numbers and the price cuts on earlier models, Apple has managed to become the king of smartphones in last quarter of 2016, 4Q2016 . When the sales from entire year is taken into consideration, Samsung managed to stay at the top. One worrying aspect for both Apple and Samsung is that BBK (owns Oppo, Vivo and Oneplus) is gaining rapidly in global market. Coming to OS marketshare, 2016 has turned any operating system other than Android and iOS into a worthless OS. A total of 1.5 billion smartphones were sold to end users in 2016 and this is up 5% from the year 2015.
Table 3. Worldwide Smartphone Sales to End Users by Operating System in 4Q2016 (Thousands of Units)
|
Operating System |
4Q2016 Units |
4Q2016 Market Share (%) |
4Q15 Units |
4Q15 Market Share (%) |
|
Android |
352,669.9 |
81.7 |
325,394.4 |
80.7 |
|
iOS |
77,038.9 |
17.9 |
71,525.9 |
17.7 |
|
Windows |
1,092.2 |
0.3 |
4,395.0 |
1.1 |
|
BlackBerry |
207.9 |
0.0 |
906.9 |
0.2 |
|
Other OS |
530.4 |
0.1 |
887.3 |
0.2 |
|
Total |
431,539.3 |
100.0 |
403,109.4 |
100.0 |
“This is the second consecutive quarter in which Samsung has delivered falling quarterly smartphone sales,” said Anshul Gupta, research director at Gartner. “Samsung’s smartphone sales declined 8 percent in the fourth quarter of 2016 and its share dropped by 2.9 percentage points year on year.”
“Samsung’s smartphone sales started to drop in the third quarter of 2016, and the decision to discontinue the Galaxy Note 7 slowed down sales of its smartphone portfolio in the fourth quarter,” added Mr. Gupta. “The withdrawal of the Galaxy Note 7 left a gap in its large-screen phone range.” Samsung also faced growing competition in the midtier and entry-level smartphone segments from Huawei, Oppo, BBK and Gionee, which all grew their sales each quarter.
Samsung is the only smartphone maker in top 4 to register negative sales growth. This is mainly due to the Galaxy Note 7 debacle where in Samsung had to cancel sales and take all the units back from users. Had Samsung managed to have a healthy Note 7 device, they would’ve been a clear #1 as the difference between Samsung and Apple is just 250,000 units. Note 7 was expected to sell in few millions. Huawei managed to grow by 1.5% but they will be worried as Oppo has more than doubled their sales figure and set to take #3 position. Though Oppo and BBK are shown as separate entities by Gartner, in reality, BBK owns Oppo so the combined figure of 15.7% makes BBK the #3 smartphone maker and very close to Samsung’s 17.8% share.
Table 1. Worldwide Smartphone Sales to End Users by Vendor in 4Q2016 (Thousands of Units)
|
Vendor |
4Q2016Units |
4Q2016 Market Share (%) |
4Q15 Units |
4Q15 Market Share (%) |
|
Apple |
77,038.9 |
17.9 |
71,525.9 |
17.7 |
|
Samsung |
76,782.6 |
17.8 |
83,437.7 |
20.7 |
|
Huawei |
40,803.7 |
9.5 |
32,116.5 |
8.0 |
|
Oppo |
26,704.7 |
6.2 |
12,961.5 |
3.2 |
|
BBK Communication Equipment |
24,288.2 |
5.6 |
11,359.4 |
2.8 |
|
Others |
185,921.1 |
43.1 |
191,708.4 |
47.6 |
|
Total |
431,539.3 |
100.0 |
403,109.4 |
100.0 |
Source: Gartner (February 2017)
The story is not that different when it came to 2016 yearly sales figures. Samsung and Apple registered negative sales but for Apple iPhone 7 managed to rescue the brand and Note 7 was hard for Samsung. Samsung is expected to release successor to Galaxy S7 in next few months and that may help Samsung turn the tables. Huawei has managed to increase their market share to 8.9%. BBK+Oppo managed to grab 10.5% of market share and this actually places BBK in #3 spot. Given how well Oppo and Vivo are selling in Asia and how they are spreading to other parts of the world, we will soon see an Apple vs Samsung vs BBK war for global domination.
Table 2. Worldwide Smartphone Sales to End Users by Vendor in 2016 (Thousands of Units)
|
Vendor |
2016 Units |
2016 Market Share (%) |
2015 Units |
2015 Market Share (%) |
|
Samsung |
306,446.6 |
20.5 |
320,219.7 |
22.5 |
|
Apple |
216,064.0 |
14.4 |
225,850.6 |
15.9 |
|
Huawei |
132,824.9 |
8.9 |
104,094.7 |
7.3 |
|
Oppo |
85,299.5 |
5.7 |
39,489.0 |
2.8 |
|
BBK Communication Equipment |
72,408.6 |
4.8 |
35,291.3 |
2.5 |
|
Others |
682,314.3 |
45.6 |
698,955.1 |
49.1 |
|
Total |
1,495,358.0 |
100.0 |
1,423,900.4 |
100.0 |
Source: Gartner (February 2017)